Energy and Civilization: The Physical Constraints Behind Every Technology Bet
Vaclav Smil reveals why transitions take generations, why welfare saturates at 110 GJ, and why energy enables but never determines.
This is Part 1 of a five-part Libido Sciendi series on Energy, Technology, and Investment. The series introduction is here. This instalment covers Energy and Civilization (Smil, 2017), the historical foundation for understanding energy transitions. Part 2 examines Power Density and the spatial constraints on deployment. Part 3 covers Ludovic Subran’s calculation of the 84% investment gap. Part 4 traces Daniel Yergin’s geopolitical maps. Part 5 asks whether AI can accelerate the transition it complicates.
TL;DR

Vaclav Smil, one of the most influential energy thinkers alive, makes three arguments that should shape how anyone invests in technology or bets on decarbonisation timelines:
1. Transitions are slow, but not uniformly. Energy sources have historically taken 50 to 75 years to capture dominant market share. Yet China’s solar deployment, doubling capacity in three years, shows that technologies with manufacturing learning curves can move faster. The 50-year rule is a central tendency, not a law of nature.
2. Welfare saturates, but the threshold may shift. Quality of life improvements plateau around 110 GJ per capita. The US consumes 300 GJ for outcomes no better than countries using half as much. But if AI and robotics unlock new welfare categories, personalised medicine, universal education, elder care at scale, the relationship between energy and flourishing could change.
3. Energy constrains but does not determine. The presence of Mozart and Haydn in the same Viennese room, or Michelangelo crossing paths with Botticelli in Renaissance Florence, cannot be explained by woodfire and draft animals. Energy sets the boundaries of what’s possible. What civilisations do within those boundaries remains a matter of choice.
When the IEA projects that global datacentre electricity demand will double to 945 TWh by 2030, these three insights become operational. Understanding infrastructure constraints, transition timelines, and the gap between what physics permits and what capital markets expect is no longer optional for technology investors.
Energy as the Only Universal Currency
“Energy is the only universal currency: one of its many forms must be transformed to get anything done.” This sentence, appearing in the opening chapter of Energy and Civilization, sets the frame for what follows. Smil, Distinguished Professor Emeritus at the University of Manitoba and author of over forty books on energy systems, built his career on quantifying what numerous pundits merely assert.
A quick word on units. Named after nineteenth-century physicist James Prescott Joule, the joule measures energy: the capacity to do work. One joule equals the energy required to lift a 100-gram apple one metre against gravity. The watt measures power: the rate of energy flow, one joule per second. A healthy adult sustains roughly 75 watts of useful mechanical output over an eight-hour work shift, approximately the power consumption of a laptop. An elite cyclist can push 400 watts for an hour. A standard construction excavator operates at around 100 to 150 kilowatts, delivering the continuous mechanical power of more than a thousand humans working in parallel. A single modern GPU cluster consumes megawatts. The orders of magnitude separating human muscle from industrial machinery are at the core of Smil’s argument.
Every economic activity is fundamentally a conversion of one kind of energy to another. Monies, in his telling, are “a convenient (and often rather unrepresentative) proxy for valuing the energy flows.”
Consider the twentieth century: between 1900 and 2000, global primary energy consumption rose nearly 9x, from 44 to 382 exajoules, while gross world product increased more than eighteen times. Picture a postcard of Paris in 1900: horse-drawn carriages, gas lamps, crowded tenements with coal stoves. Now picture Paris in 2000: the RER, the périphérique at rush hour, La Défense glittering with air-conditioned towers. Two industrial revolutions, the automobile, aviation, electrification, the entire transformation of how humans live, work, travel, and communicate. All of it, at bottom, translates to one thing: more joules flowing through more machines.
This framing resonates strongly in France, where Jean-Marc Jancovici has spent two decades making the same argument in policy circles and boardrooms. His graphs showing the tight correlation between French energy consumption and economic output have made him one of the most influential voices on energy transition in Europe.
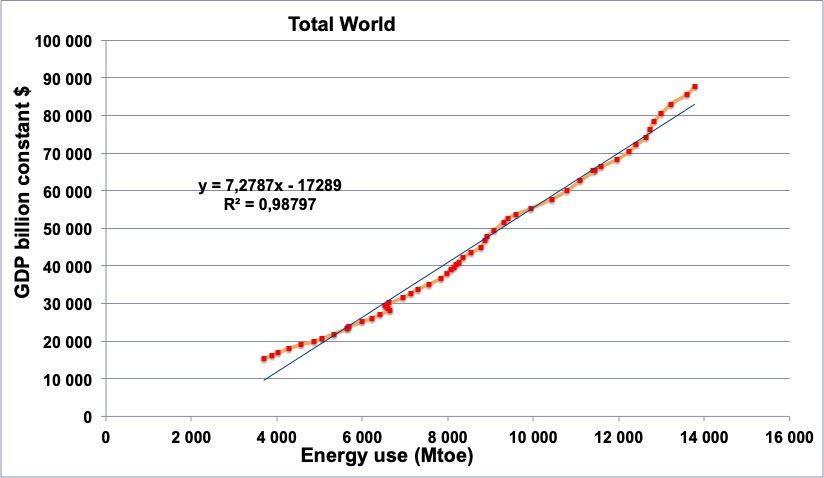
Jancovici puts it bluntly: “the economy is nothing else than the transformation, on a very large scale, of natural resources into something else.” When energy supply decreases, GDP follows, typically with a one to two year lag. The correlation holds across France, Italy, and most OECD countries. Energy is not an input to the economy. Energy is the economy.
When we model an AI company’s unit economics, we are implicitly pricing energy transformations, often without realising it. The silicon wafers require high-temperature furnaces. The inference clusters demand power and cooling. The data pipelines assume ubiquitous low-latency telecommunications. Each layer rests on others, each layer converts energy into useful work. Smil’s contribution is to trace these dependencies backward through 10,000 years of technological development, quantifying precisely how each conversion constrained the civilisations that depended on it.
Why Cities Couldn’t Grow: Power Density Before Coal
One of the most illuminating sections of the book concerns a more granular metric: power density, defined as the rate at which energies are produced or consumed per unit of area. We will explore this concept in depth in Part 2, which covers Smil’s dedicated treatise Power Density (2015). For now, the historical perspective.
Traditional city size depended on fuelwood and charcoal, both limited by the inherently low power density of phytomass production.
Consider the arithmetic:
-
Forest & energy. Sustainable annual tree growth in temperate climates produces at best 0.6 watts per square metre. A large eighteenth-century city required at least 20 to 30 watts per square metre of its built-up area for heating, cooking, and artisanal manufactures. This ratio, roughly 30 to 50 times, meant that cities had to draw on nearby areas at least 30 times their size for fuel supply. Even where food and water were adequate, urban growth was physically bounded.
-
Charcoal & energy. Charcoal, preferred for indoor heating by all traditional civilisations, made matters worse. With conversion losses of about 70%, the power density of wood destined for charcoal production dropped to approximately 0.2 watts per square metre. A northern city relying heavily on charcoal, like Beijing under the Qing dynasty, would have required a wooded area at least 100 times its size to ensure continuous supply. This arithmetic helps explain the patterns of deforestation around the Mediterranean and in North China that permanently altered regional ecologies, a constraint any contemporary analysis of biofuels or hydrogen production must reckon with.
When we discuss the land requirements of solar farms, the power density constraints on biofuels, or the siting challenges for large datacentres, we are working within the same conceptual framework. Smil notes that modern civilisation has been climbing up the power density ladder, from dispersed biomass to concentrated fossil fuels. The energy transition asks us to climb back down, from high-density coal and oil to more dispersed wind and photovoltaics. Andrew McAfee has documented how rich economies are dematerialising, using fewer resources per unit of GDP. But dematerialisation is not the same as decarbonisation. The arithmetic of power density does not disappear easily.
The Persistence of Old Technologies
Smil’s data on prime mover deployment challenges the disruption narratives that dominate the usual tech debate. Adoption of state-of-the-art technologies takes time.
Take animal labour as an example. In 1850, animate labour, meaning human and animal muscles, still accounted for more than 80% of the world’s prime mover capacity. In the 1900s, its share was still about 60%, with steam engines supplying roughly one-third. Only by 2000 (yes, 2000, not 1945 or 1980) did internal combustion engines and electricity generators claim nearly all available installed power.
This echoes Jared Diamond’s argument in Guns, Germs and Steel about the decisive importance of domesticable large animals. Eurasia had 13 species of large mammals suitable for domestication; the Americas had one. Diamond argued this geographic luck shaped which civilisations developed agricultural surpluses, dense populations, and eventually technological complexity. Smil extends his analysis: the persistence of animal labour long into the industrial era shows how slowly even superior technologies displace their predecessors when the older systems remain functional and the installed base is vast.
And don’t think it’s just flawed data from underdeveloped countries. American statistics sharpen the point. Mechanical power in farming topped horse and mule power only during the late 1920s. Millions of mules worked in the U.S. South in the early 1950s. The U.S. Department of Agriculture stopped counting working animals only in 1963.
Same in the UK: in 1500, human and animal exertion accounted for 85% of all power in England. By 1800, the share was still 87%. Steam had taken over industries by 1900, reducing animate labour to 27% of total power, but even then human muscles remained indispensable in extracting and distributing fossil fuels and in countless manufacturing tasks.

When we think of adoption curves for autonomous vehicles, replacement of human labour by AI, or personal robotics, we should keep in mind that even if the pace of adoption tends to accelerate, historical patterns show that old and new technologies coexist for much longer than disruption narratives suggest. Roman water mills were first used during the first century BCE but became widespread only about 500 years later. Sail ships had made circumnavigation commonplace by the late sixteenth century, yet heavily gunned Swedish galleys with convicted oarsmen destroyed most of the Russian fleet at Svensksund in 1790.
The most instructive example may be the Liberty ship. During World War II, the United States built 2,710 Liberty-class cargo ships, the backbone of Allied logistics.
These vessels were powered not by modern diesel engines, which were more efficient, but by older three-cylinder steam engines supplied by oil-fired boilers. The choice was deliberate and rational: steam engine production could be scaled rapidly using existing manufacturing capabilities, while diesel production would have required retooling and workforce retraining.
Path dependency compounds through optimisation. A technology that has been deployed for decades accumulates institutional knowledge, trained workforces, supply chains, and incremental refinements that a superior newcomer lacks. The Liberty Ship’s steam engines were not just available; they were understood. Shipyards knew how to build them. Crews knew how to operate them. Spare parts existed. A theoretically superior technology must overcome not just its own learning curve but the incumbent’s accumulated advantages. This is also why transitions take generations, not product cycles.
Under time pressure, proven capability matters much more than theoretical superiority. This logic still applies to infrastructure buildouts today: Microsoft, Amazon, and Google are not necessarily deploying the most efficient power solutions for their datacentres. They are deploying whatever they can get connected to the grid fastest.
The 50-Year Rule (And When It Breaks)
Smil has become famous, perhaps notorious, for his insistence that energy transitions take 50 to 75 years for a new resource to capture a large market share. The transition from wood to coal took more than a century. Oil was first commercially produced in the 1860s but did not reach 10% of market share until 50 years later. It took another 30 years to raise that share from 10% to 25%. Natural gas, first available around 1900, did not reach 20% of the total energy market until 1970.
Indeed, as long as established sources work well within established settings, are readily available, and are profitable, their substitutes will advance only slowly. Infrastructure matters: even if renewables were free, “it would be economically unthinkable for nations to abandon the enormous investments already made in the fossil fuel system, from coal mines and oil wells to pipelines, refineries, and hundreds of thousands of filling stations.” China spent half a trillion dollars adding nearly 300 gigawatts of new coal-fired generating capacity between 2001 and 2010, and it expects those plants to operate for at least 30 years.
But here the historical record is more varied than Smil’s headline figure suggests. Transition speed depends dramatically on the energy source in question.
Solar has defied the historical pattern in ways that deserve attention. China’s wind and solar generation capacity more than doubled in just three years to 2024, from 635 GW to 1,408 GW. In early 2025, the capacity of wind and solar combined overtook that of coal. China installed 277 GW of solar capacity in 2024 alone, more than twice the entire installed solar capacity of the United States. In the first half of 2025, China installed more solar than the rest of the world combined. This is closer to a decade, very far from the 50-year transition.
What explains the difference? Solar benefits from manufacturing learning curves that previous energy sources lacked. Unlike coal mines or oil wells, solar panels are manufactured products whose costs decline predictably with cumulative production. The technology can be deployed in modular increments without the massive upfront capital commitments of a nuclear plant or refinery. And crucially, solar does not require rebuilding the entire downstream infrastructure: electrons from solar panels flow through existing transmission lines to existing appliances.
Nuclear tells the opposite story. France’s Flamanville 3 EPR reactor, originally budgeted at €3.3 billion for completion in 2012, finally connected to the grid in December 2024 at a cost exceeding €13 billion. The first new EPR2 reactors are now projected to come online no earlier than 2038, with cost estimates for six planned units having risen from €52 billion to €80 billion. Olkiluoto 3 in Finland, the first EPR to begin construction, took 18 years from groundbreaking to commercial operation. Nuclear offers power densities comparable to fossil fuels, but its transition timelines stretch even longer than historical coal or oil patterns because of regulatory complexity, first-of-a-kind engineering challenges, and loss of institutional knowledge during decades of minimal construction.
Transition timelines are not uniform. Technologies that can leverage manufacturing scale curves, deploy modularly, and plug into existing infrastructure may move faster than Smil’s historical averages. Technologies that require massive upfront capital, new regulatory frameworks, and specialised workforces will move slower. The 50 to 75 year figure is a central tendency, not a law of nature.
The 110 GJ Threshold
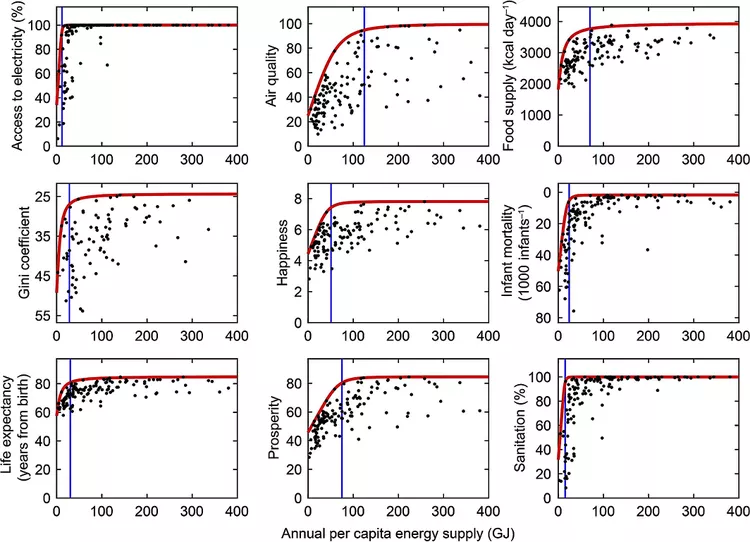
The most important graph in Smil’s book plots average per capita energy consumption against the Human Development Index. The relationship is linear only during the lower stages of development. Beyond a threshold of approximately 110 gigajoules per capita per year, Smil writes, “there is no discernible improvement in fundamental quality of life.”
The data is stark: “Relatively low infant mortalities, below 20 per 1,000 newborns, and relatively high female life expectancies, above 75 years, can be achieved with 60 to 65 GJ per capita.” The world’s top rates, infant mortality below 10 per 1,000 and female life expectancy above 80, “require at least 110 GJ per capita. Above that, the curve flattens.”
A Stanford University study, which examined human wellbeing and per capita energy use across nine key metrics of health, economic, and environmental wellbeing, confirmed that almost all nine factors top out at about 75 gigajoules per person, a quarter of the American average. The rest isn’t adding much.
America’s position is instructive. Consuming roughly 300 GJ per capita in 2015, the United States showed quality-of-life indicators inferior not only to leading EU economies and Japan, which use half the American rate, but to many countries with intermediate energy use. Smil notes that “America’s infant mortality rate of 6.6 per 1,000 live births ranked 31st worldwide, more than double that of Greece.” American life expectancy ranked 36th, barely better than Cuba. In PISA assessments of 15-year-olds, American students ranked just below Russia and Slovakia in science, far behind Germany, Canada, or Japan.
Where does the excess energy go? Smil is pointed: “ostentatious housing, multiple expensive vehicles, and frequent flying.” As average American family size declined, the average size of U.S. houses more than doubled since the 1950s. The energy transformed into heated square footage and personal aviation does not register in infant mortality statistics or educational outcomes.
This threshold deserves to be challenged. The 110 GJ figure captures a real diminishing returns effect, but it was observed at a specific point in technological development. The composition of energy consumption matters enormously: a society spending marginal energy on efficient public transit versus oversized personal vehicles will show different welfare outcomes at the same total consumption level.
More importantly, the threshold might shift upward in a world where AI and robotics unlock new categories of welfare improvement. If machine intelligence can deliver personalised education, early disease detection, or elder care at scale, the relationship between energy input and human flourishing could change. The 75–110 GJ threshold is convincing today, but it does not preclude different futures. Some of those futures may be vain and wasteful. Others could lead to better, longer lives and greater human flourishing.
Despite this challenge, the implications for modelling economic returns to energy abundance remain significant. If quality of life saturates well below the consumption levels of rich nations, the marginal utility of additional energy supply is not evenly distributed. Bringing 40 GJ per capita to societies currently at 10 GJ per capita delivers life expectancy gains. Adding 100 GJ per capita to a society already at 300 GJ per capita delivers larger houses and more flights.
Against Energy Determinism
Throughout the book, Smil makes a crucial point that we shouldn’t lose while learning about energy. Having established that energy flows constrain civilisational possibilities, he refuses to claim that they determine civilisational outcomes.
The argument appears in his final chapter: “Dominant fuels and prime movers are among the most important factors shaping a society, but they do not determine the particulars of its successes or failures.” The genesis of the link between energy and civilisation is not surprising. Only the rising consumption of fossil energies has been able to satisfy so many material desires on such a large scale. Greater possessions and comforts have become equated with civilisational advances. “But such energetic determinism, like any other reductionist explanation, is highly misleading.”
Formulations of universal and lasting ethical precepts by ancient thinkers and founders of durable religions were all accomplished in low-energy societies where most of the population was preoccupied with basic physical survival. Christianity and Islam arose in arid environments where agrarian societies had no technical means to convert abundant sunshine into useful energy. The Greeks, who spoke of slaves as man-footed creatures on the level of working animals, gave us the fundamental ideas of individual freedom and democracy. “The concurrent advance of freedom and slavery is one of the most remarkable aspects of Greek history.”
Late nineteenth-century Germany embraced aggressive militarism just as it became continental Europe’s leading consumer of energy, while Italy and Spain became dictatorships in the 1920s and 1930s when their per capita energy use was among the lowest on the continent.
Conceptual Toolbox
| Concept | Definition | Excerpt from Smil | Implication |
|---|---|---|---|
| Power density | Rate of energy production or consumption per unit area, measured in W/m² | ”Cities consumed 20–30 W/m² while forests produced only 0.6 W/m², requiring fuel-sheds 30–50x the urban footprint” | Land requirements for datacentres, solar farms, and hydrogen must be evaluated in power density terms |
| Energy transition pace | Historical pattern showing 50–75 years for new resources to capture dominant market share | ”Coal surpassed fuelwood combustion only during the 1880s” | Investment timelines should assume multi-decade horizons unless clear mechanisms accelerate adoption |
| Path dependency | Installed systems and institutional knowledge create barriers to transition regardless of superior alternatives | ”In 1850 animate labour still accounted for more than 80% of the world’s prime mover capacity” despite steam’s clear superiority | Labour displacement forecasts for AI should model coexistence periods, not rapid substitution. Incumbents optimise for decades. |
| Quality-of-life saturation | Welfare indicators stop improving above ~110 GJ/capita | ”There is no discernible improvement in fundamental quality of life above that level” | Marginal returns to energy abundance are geographically unequal |
| Energy determinism fallacy | Confusing necessary conditions with sufficient conditions | ”Even small fields can offer brilliant tapestries whose creation is not easy to explain” | Technological capability does not determine what societies choose to build |
| Infrastructure lock-in | Installed systems create barriers to transition regardless of superior alternatives | ”It would be economically unthinkable for nations to abandon the enormous investments already made” | Evaluate new technologies on infrastructure compatibility, not just LCOE |
Orthogonal Insight: The Mass-to-Power Ratio
Smil tracks the mass-to-power ratio of prime movers across centuries. Early steam engines, while much more powerful than horses, were exceedingly heavy, with mass-to-power ratios of the same order of magnitude as draft animals. Two centuries of development lowered the ratio to about one-tenth of initial values, still too high for road vehicles or flight. Internal combustion engines reduced the ratio by two orders of magnitude in less than 50 years after commercial introduction. Gas turbines, starting in the 1930s, carried these improvements by almost another two orders of magnitude, making jet travel possible.
The lesson: transformative applications often follow dramatic reductions in mass-to-power ratio, not just improvements in efficiency or cost. When evaluating novel energy technologies, from solid-state batteries to fusion reactors, tracking this metric may reveal deployment possibilities that levelised cost comparisons obscure.
Closing Note
The IEA projects global datacentre electricity consumption will double to 945 TWh by 2030. In the US, datacentres are on course to account for almost half of electricity demand growth this decade, consuming more electricity by 2030 for processing data than for manufacturing aluminium, steel, cement, and chemicals combined.
They are power plants that must be permitted, financed, built, and connected to grids already straining under existing loads. Microsoft is not restarting Three Mile Island because nuclear is fashionable, but because solar at 10 watts per square metre cannot power a datacentre campus at 500 watts per square metre without claiming fifty times the land and solving storage problems that remain unsolved.
The 50-year rule, the 110 GJ threshold, the infrastructure lock-in: these constraints do not yield to exponential thinking. They yield to capital, concrete, and time.
Near the end of his final chapter, Smil describes an imaginary idler on Florence’s Piazza della Signoria around 1505, passing in a matter of days Leonardo da Vinci, Raphael, Michelangelo, and Botticelli. He writes: “A concatenation of creative talent that is utterly inexplicable by the combustion of wood and the harnessing of draft animals, the common practices that could be seen in any other contemporary city in Italy, Europe, or Asia.”
Energy sets the boundaries. What we build within them remains our own affair.
Next in the series: Part 2 examines Power Density (Smil, 2015), quantifying exactly how much land any energy source requires, and why that arithmetic now determines where AI infrastructure can be built.