Market Sizing for Founders
A practical framework for sizing markets when you're building something new.
Executive Summary
The Core Insight: Markets Are Made, Not Found
In technology, demand is endogenous: created by products that reshape behaviour, not discovered in analyst reports. AWS didn’t find a $100B cloud market; it created one by turning servers into elastic computing. Uber didn’t compete for the taxi market; it invented mobility budgets. Today, ElevenLabs is creating the voice synthesis market, Perplexity is transforming search from links to answers, and Suno is turning music generation from demos into production workflows.
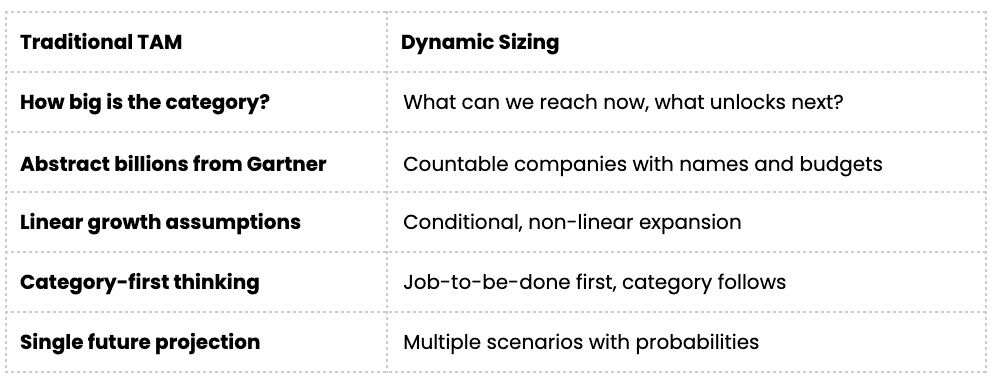
Static TAM circles are theater. Real market sizing is dynamic, it maps what you can reach today to what you’ll unlock tomorrow.
The Framework: From Entry Market to Expansion Mixes
Replace the traditional TAM/SAM/SOM cascade with a more actionable model, a dynamic sizing that ties a precise Entry Market (SAM0) to a set of Expansion Mixes (SAM1, SAM2, etc.) across geography, segment, and product.
Market sizing should bridge narrative and numbers. Start with a clear job-to-be-done (JTBD), identify what you displace (substitutes) and what you depend on (complements), then count the sales-qualified ICP you can actually reach today, companies with names, budgets, and clear problems. This defines your Entry Market.
From there, growth isn’t linear. You unlock expansion mixes when specific conditions align, product maturity, reference customers, regulatory clearance, or complementary infrastructure. Each mix represents a new market configuration, not just bigger circles. The pattern repeats across tech history: Slack transformed email from inbox to workspace, Lovable turned “I need a website” from a project into a prompt, and HeyGen evolved avatars from novelty to enterprise-grade synthetic media.
Entry Market (SAM0): Your Sales-Qualified Beachhead
- Start with JTBD: What critical job are customers hiring you to do?
- Count real buyers: Not market research abstractions, but sales-qualified ICP, companies you can name, with tangible behaviours, budgets you can access, and problems they need solved today
- Formula: [Sales-Qualified ICP Count] × [Users per Account] × [Realistic AOV] × [Achievable Penetration %]
- Example: “500 US law firms with 50+ attorneys specialised in corporate laws using Microsoft stack, with >25% of team members using ChatGPT/Claude daily, and with at least one legal tech adopted within the firm”
- Key test: Must be sales-qualified (you can name them) and behaviourally ready
Expansion Mixes: Non-Linear Growth Patterns
Growth doesn’t follow a ladder, it’s more like unlocking rooms in a house. Some doors open together, some stay locked, some lead to bigger rooms than expected.
Non-linear dynamics:
- Simultaneous unlocks: Geographic expansion + new segment (Stripe: UK + marketplaces)
- Accelerating unlocks: Payments enabling international expansion (Shopify)
- Blocked paths: Platform plays that never materialise (Evernote)
- Surprise unlocks: COVID making Zoom the enterprise standard overnight, leading to a step function in terms of adoption.
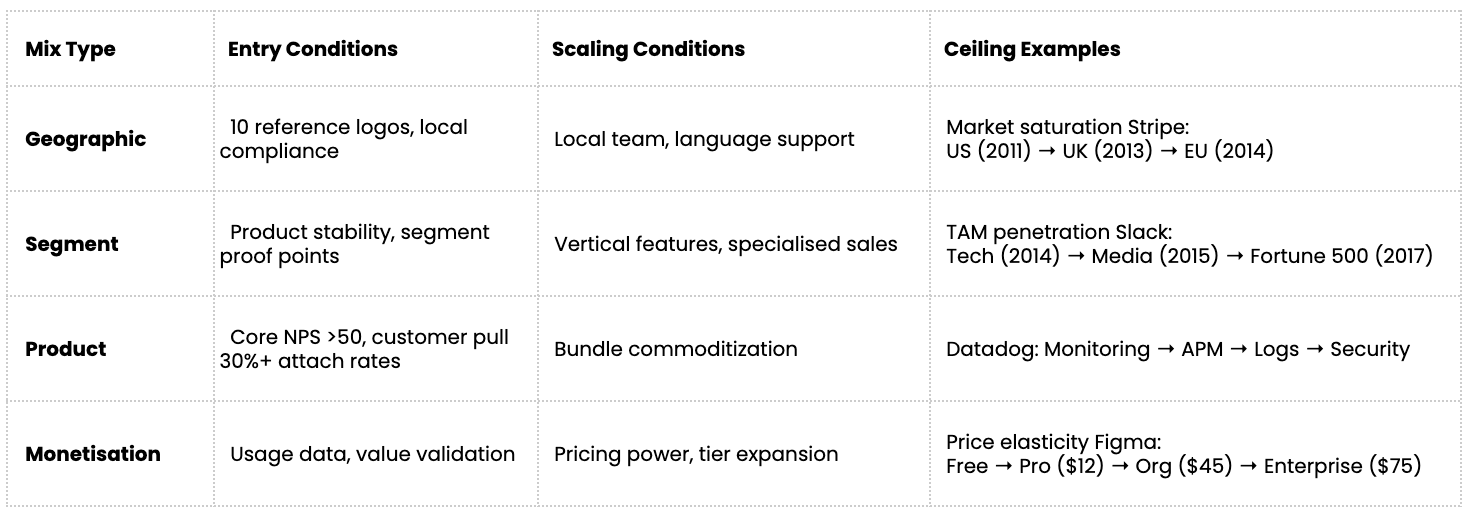
Key insight: Mixes are options you earn through execution, not entitlements. The market grows as you unlock each mix.
The Practical Output: Three Deliverables
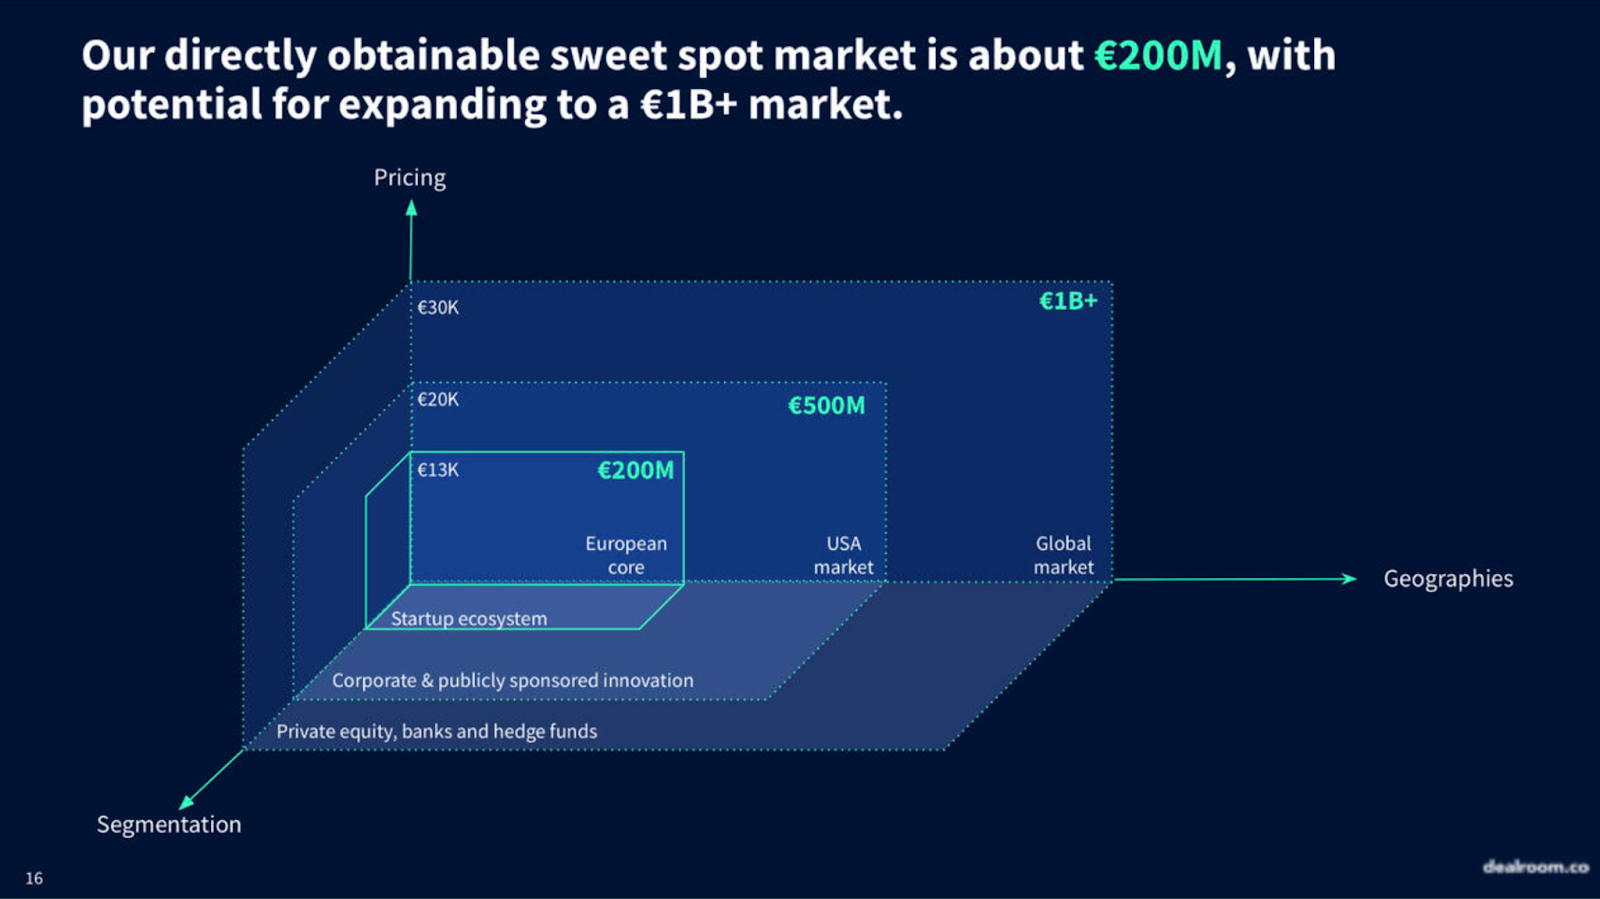
1. Layered TAM Cube (Visual)
A 3D representation showing your Entry Market at the core, surrounded by conditional expansion zones, each labeled with size and unlock conditions.
2. Price × Users Progression (Chart)
Shows how pricing tiers and user expansion interact, with diagonal lines indicating ARR potential.
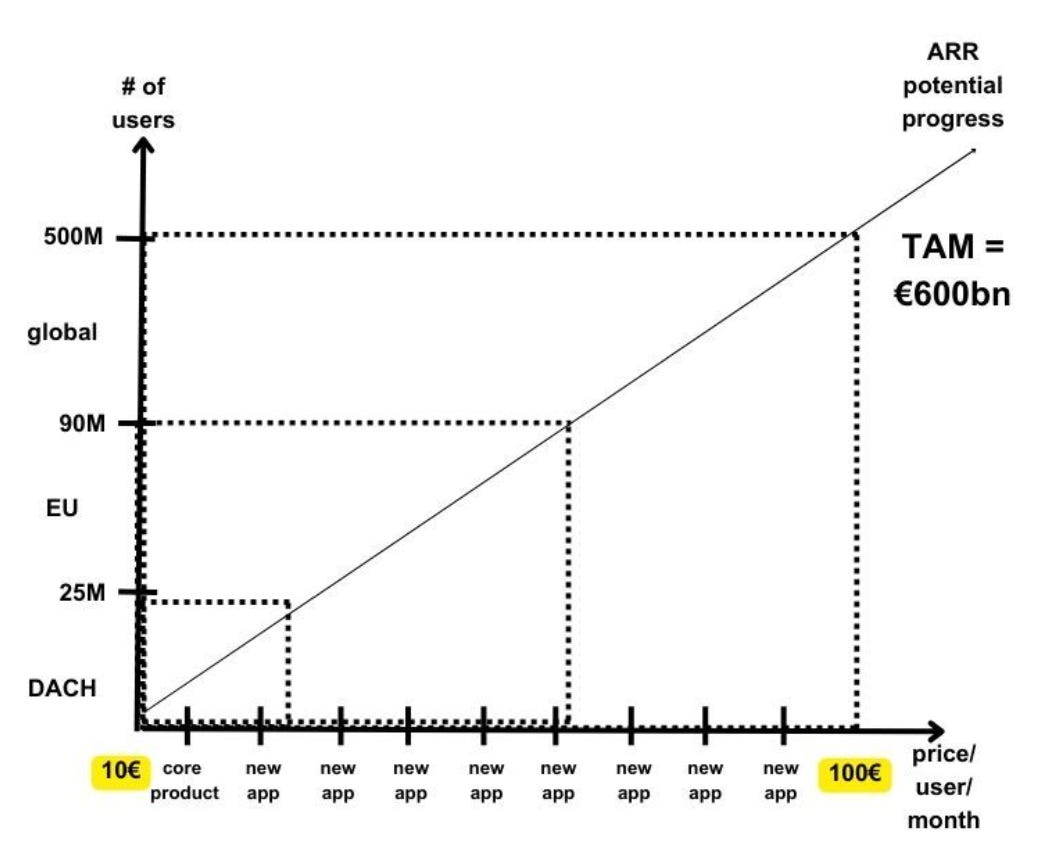
Slide from Hanno Renner (Personio), via Martin Mignot
3. Bottoms-Up Calculation (Spreadsheet)
Entry Market math with explicit assumptions, not buried in formulas:
- ICP Definition: Firmagraphics + technographics + behaviour signals
- Penetration Logic: Why 5% not 50%? Based on what comparables?
- Price Justification: Anchored to value created or budget displaced
What Changes vs. Traditional Approaches
Simple Under Uncertainty
The earlier your stage, the simpler your model. As Gerd Gigerenzer’s work on heuristics shows, in environments of high uncertainty, simple rules outperform elaborate models. The job is not precision; it is clarity.
At the earliest stage, your Entry Market should fit on a napkin; your expansion story should be memorable without slides. Numbers without story are sterile; stories without numbers are fantasy. Market sizing is the bridge.
Bottom line: Great founders don’t show the biggest TAM; they show the clearest path.
Full Article
1. Market Sizing as the Foundation of Strategy
Market sizing is one of the most misunderstood exercises in entrepreneurship. Too often, it becomes a decorative slide in a pitch deck: three circles labeled TAM, SAM, and SOM, with an analyst report number pasted on top.
But market sizing should be something more fundamental. It’s the foundation that shapes your strategic thinking on how you build, hire, and scale. Done well, it helps you understand not just the size of today’s opportunity, but how that opportunity might expand or contract based on technology shifts, customer behaviour, and your own execution.
The paradox is that the more innovative your market, the simpler your sizing approach should be. Complex spreadsheets create false precision in uncertain environments. As Gerd Gigerenzer’s research demonstrates, simple heuristics consistently outperform elaborate models when the future is unknowable. You need clarity and explicit assumptions, not 50-tab models that obscure more than they reveal.
TERMINOLOGY BRIDGE: Throughout this playbook, we use “Entry Market” (or SAM0) instead of SOM, and “Expansion Mixes” (and SAMn) instead of traditional SAM/TAM segments. This shift emphasises dynamic growth over static categories.
1.1. Why Market Sizing Matters Strategically
Company building in technology requires you to operate on multiple time horizons simultaneously. You’re solving today’s problems while preparing for tomorrow’s scale. The ability to attract talent, capital, and customers depends on a credible story about where you’re headed.
Market sizing shapes every major decision:
- Product strategy: A concentrated market of 1,000 enterprises demands deep, workflow-specific features. A diffuse market of 100,000 SMBs demands simplicity and self-service. Your market assumptions determine your product philosophy.
- Go-to-market approach: The difference between direct sales and product-led growth isn’t preference, it’s market structure. Concentrated markets require relationships; fragmented markets require virality.
- Capital efficiency: The relationship between market size and capital raised determines your outcome. Raising $50M to pursue a $100M market guarantees failure. Raising $5M to validate a $10B opportunity preserves optionality.
- Talent magnetism: Exceptional people join companies attacking large, expanding markets (Blockbusters (2013), from Anita Elberse is a must-read on the matter). Your market narrative doesn’t just inform strategy, it determines who you can convince to join the journey.
- Competitive dynamics and timing: Your sizing assumptions determine whether to optimise for speed-to-market (capturing first-mover advantages in nascent markets), market education (bearing the cost of category creation), or differentiation (in already established markets with room for multiple winners). These decisions directly influence when to fight versus when to seek adjacent opportunities, and critically, how your execution can actually expand the market itself rather than just capturing existing demand.
The cost of getting this wrong compounds. Too small a market and you’ll find yourself under-resourced and outmaneuvered. Too grand and unfocused, and you’ll burn capital without finding product-market fit.
Key Takeaway: market sizing is not a superficial exercise to satisfy investors. It’s a strategic tool to prepare for growth, calibrate ambition, and align stakeholders around a shared vision.
2. The Problem with Traditional TAM/SAM/SOM
The three nested circles of TAM, SAM, and SOM have become so ubiquitous that investors expect them in every pitch. TAM represents the total market if you achieved 100% share, SAM the portion you could theoretically serve, and SOM what you might realistically capture.
This framework feels rigorous but obscures more than it reveals. Here’s why traditional market sizing fails founders:
2.1. The Four Fatal Flaws
1. Markets aren’t waiting to be captured; they’re created. Traditional TAM assumes demand exists, waiting for your solution. But the biggest outcomes create their own demand. AWS didn’t capture the “server market” — it invented cloud computing. The TAM didn’t exist until they built it.
2. Gartner numbers are meaningless without context. “The AI market will be $500B by 2030” tells you nothing. Which AI? For whom? Replacing what? It’s like saying “the food market is $8 trillion” when you’re opening a restaurant.
3. Static circles hide the actual path. TAM/SAM/SOM shows size but not sequence. Which customers do you win first? What unlocks the next segment? Why would growth accelerate? The circles can’t answer.
4. Categories evolve faster than reports. By the time Gartner publishes a market size, the leaders are already creating the next market. Datadog wasn’t in the “monitoring” TAM; they created observability. The report follows the market, not vice versa.
2.2. The Historic Debates: Narrative vs. Numbers
The tension in market sizing is best captured by two famous disagreements that shaped Silicon Valley thinking:
Thiel vs. Hoffman on Facebook (2004)
Thiel asserted, as recounted in Reid Hoffman’s book Blitzscaling (2018): “The college student market is only 10 million people. Even at 100% penetration, that’s a small TAM.”
Hoffman’s answer? “It’s not about college students. It’s about human social connection. The TAM is everyone with internet access.”
Facebook now has 3 billion users, worth ~$1 trillion.
Damodaran vs. Gurley on Uber (2014)
Aswath Damodaran (NYU Stern finance professor) published his Uber valuation at $6B, using traditional TAM analysis of the global taxi market (~$100B). Bill Gurley (Benchmark partner) responded with his famous How to Miss By a Mile essay, arguing Damodaran missed the market expansion dynamics.
Damodaran: “The global taxi and limo market is $100B. Even if Uber takes 10%, that’s $10B revenue, maybe worth $25B.” Gurley: “Uber isn’t competing for the taxi market. It’s expanding the market by making transportation so convenient that people give up their cars, take more trips, and businesses replace delivery fleets.”
Gurley was right. Uber’s mobility market became ~$500B, not $100B.
Note aside: Damodaran later admitted he had underestimated the power of narrative. In Narrative and Numbers (2017), he developed a full framework for how valuation always lives in the tension between story and spreadsheet:
- Stories without numbers are fantasy. They seduce but can’t be tested.
- Numbers without stories are sterile. They look rigorous but fail to capture transformative shifts.
- Strong valuations tie narrative and numbers together, making assumptions explicit and testable.
These debates crystallise the difference between static analysis (counting existing markets) and dynamic thinking (understanding market creation). The finance professors and even brilliant investors thinking statically missed the scale by 10-100x.
2.3. Case Examples: Markets That Didn’t Exist
Airbnb (2009)
- Traditional TAM: Budget hotels (~$20B)
- Created Market: Peer-to-peer lodging ($100B+)
- What changed: Turned unused space into inventory, travelers into locals
Slack (2014)
- Traditional TAM: Team communication software (~$2B)
- Created Market: Workplace collaboration platform ($20B+)
- What changed: Transformed email from communication to notification
Stripe (2011)
- Traditional TAM: Online payments (seemed saturated with PayPal)
- Created Market: Developer-first economic infrastructure ($100B+)
- What changed: Made payments a few lines of code, not a business partnership
Databricks (2013)
- Traditional TAM: Data warehousing tools (~$10B)
- Created Market: Unified analytics platform ($50B+)
- What changed: Collapsed the distinction between data engineering and data science
Key Takeaway: The best companies don’t compete for existing TAMs; they create new categories. Static circles can’t capture this dynamic.
3. A Better Framework: Dynamic Market Sizing
Markets in technology are not static territories to be conquered but dynamic systems that evolve with innovation. The framework that captures this reality moves beyond fixed circles to conditional expansions.
3.1. Core Principles
- Demand is endogenous in technology: You don’t discover demand; you create it. Your product changes customer behaviour, which expands the market itself. Notion didn’t capture the “note-taking market” — they created a new workspace category that subsumed documents, wikis, and databases.
- Jobs transcend categories: Markets should be defined by the job-to-be-done, not by existing software categories. Customers don’t budget for “CRM software”, they budget to solve “never losing track of a customer.” The job persists even as categories blur and merge.
- Expansion happens in discontinuous jumps: Growth doesn’t follow smooth curves. New market segments unlock when specific conditions are met: achieving compliance, proving ROI, reaching critical mass. These are step functions, not gradual progressions.
- Multiple futures require scenario planning: Rather than false precision, model three worlds: bull (market dynamics align), base (solid execution), and bear (headwinds persist). Assign probabilities based on evidence, not hope.
3.2. The New Vocabulary
- Entry Market (SAM0): The precisely defined, countable set of customers you can reach with your current product in the next 12-24 months
- Expansion Mixes (SAM1, SAM2, etc.): Conditional market expansions that unlock based on specific triggers
- Terminal Market: The theoretical maximum if all expansion mixes unlock and you achieve category leadership
3.3. Quantifying Endogenous Demand Creation
Market creation follows predictable patterns:
- Substitution: New solution captures 20-40% of old market, expands 3-5x beyond
- Augmentation: Adds 50-150% to existing market through new use cases
- Creation: 10-100x expansion when enabling previously impossible workflows
3.4. Examples of Dynamic Expansion
Cursor (2023-2024)
- Entry Market: Professional developers using VS Code (~2M)
- Expansion Mix 1: Semi-technical users who couldn’t code before (~10M)
- Expansion Mix 2: Business users automating workflows (~50M)
- Mechanism: AI makes coding accessible to non-programmers
Perplexity (2022-2024)
- Entry Market: Researchers needing cited answers (~10M)
- Expansion Mix 1: Knowledge workers replacing Google (~100M)
- Expansion Mix 2: Enterprise search replacement (~10,000 companies)
- Mechanism: Transforms search from links to answers
Canva (2013-2024) Shows how a company can progressively unlock mixes over a decade:
- 2013-2015: Social media managers (Entry Market: ~1M users)
- 2015-2018: Small business owners (Expansion 1: ~10M users)
- 2018-2021: Students and educators (Expansion 2: ~50M users)
- 2021-2024: Enterprise creative teams (Expansion 3: ~100M users)
- Market created: From “$0 design tools for non-designers” to “$20B+ visual communication platform”
Key Takeaway: Dynamic sizing captures how markets evolve through players’ execution. Each expansion mix represents a new market creation opportunity, not just geographic or segment extension.
4. From Theory to Practice: Building Your Dynamic Market Model
4.1. Defining Your Entry Market
Your Entry Market represents the customers you can actually win in the next 12-24 months with your current product and go-to-market capabilities. This is not an aspiration or a theoretical calculation, it’s a concrete set of companies with names, budgets, and urgent problems.
The discipline of defining your Entry Market forces clarity about who you serve and why they would buy today, not someday. Most founders struggle here, defining markets that are either impossibly broad (“all SMBs”) or arbitrarily narrow (“dentists in the Valley using Salesforce and with a subscription to Claude Pro”). The right definition balances specificity with scale.
The Entry Market Formula
Entry Market = Qualified ICP Count × Adoption Rate × Revenue Per Account
Where:
- Qualified ICP Count = Total Firms × ICP Filters
- Adoption Rate = Awareness % × Win Rate % × [Year 1-2] Penetration %
- Revenue Per Account = Users per Account × Price per User
4.3. Critical Benchmarks for Entry Market Sizing
Users per Account by Segment:
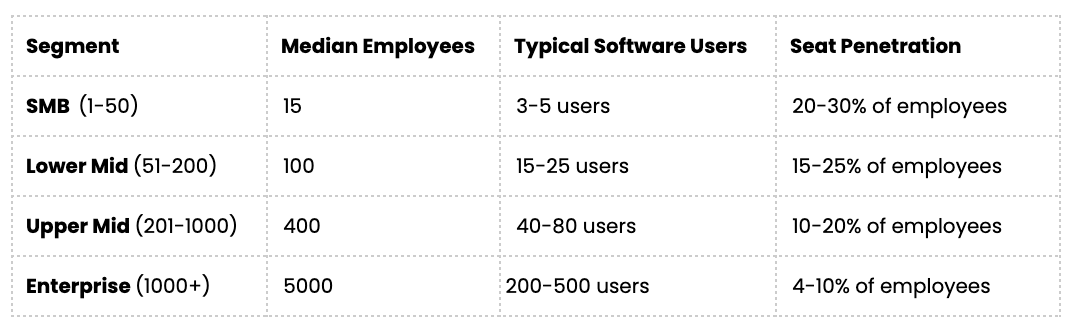
Note: Developer tools and horizontal platforms see higher penetration. Seat penetration is only heuristics and highly dependent of context. More infos: SaaS Benchmarks report
Annual Contract Values for Healthy Unit Economics:
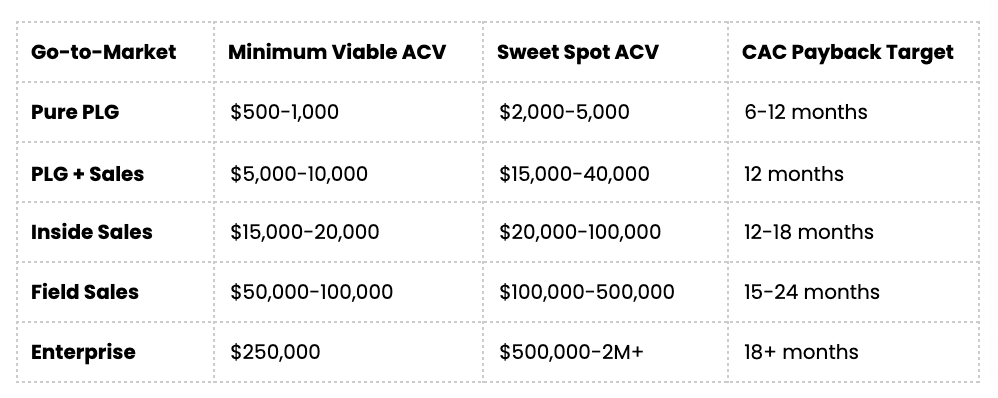
Rule of thumb: If ACV < 2x fully-loaded sales cost, the model breaks. Indicative benchmarks. Actual ACV ranges and CAC payback vary significantly by sector and region. More infos: Jason Lemkin’s SaaStr and Bessemer’s State of the Cloud
Advanced ICP Filtering: From Market Size to Sales Reality
The best early-stage companies don’t just count companies, they identify behavioural signals that predict who will actually buy. This bridges market sizing with executable GTM strategy.
The Modern ICP Filter Stack
1. Foundation Filters (Traditional)
- Company size, industry, geography
- Tech stack compatibility
- Budget availability
- Growth trajectory / Recent fundraising
2. Innovation Readiness: these filters help you narrow from “total addressable companies” to “companies ready to buy innovative solutions”:
- Tech DNA Indicators (strong predictor of early adoption)
- AI adoption proxy (e.g.: employees using ChatGPT/Claude daily/weekly, even better vertical AI tools)
- Tool velocity (e.g.: adopted 3+ new SaaS tools in past 12 months; you can use BuiltWith/Datanyze)
- Developer density (e.g.: engineering headcount >20% suggests innovation culture)
- Cloud maturity (e.g.: using modern stack like AWS/GCP; people using vertical SaaS tailored for their industry)
- Behavioural Proxies (moderate predictor)
- Content creation (e.g.: employees sharing/engaging on social media)
- Event attendance (e.g.: presence at forward-thinking conferences/meetups)
- Open source activity (e.g.: engineers contributing to GitHub)
- Job postings language (e.g.: looking for “full-stack”, “AI”, “automation” vs. legacy terms)
- Organisational Signals (directional)
- New leadership (e.g.: CTO/CPO/VP Eng hired in past 6 months)
- Strategic announcements: Digital transformation, AI initiatives in press/investor updates
4.2. Mapping Expansion Paths
Most startups wedge into a small part of the market, then scale outward. For technology companies, expansion typically follows three classic axes: geography, customer segments, and product scope. Each axis increases addressable demand. But remember also that expansion is never linear, and rarely fully additive.
The Three Axes
- Geography. Expanding into new countries multiplies the available customer base, but it comes with local ecosystems and regulations, cultural differences, and competition dynamics. Spotify left the Nordics early because its home market was too small; many US SaaS companies delay international expansion because the US is deep enough to fuel years of growth.
- Customer segments. Moving from SMB to enterprise is one of the most consequential choices. SMBs offer faster adoption but limited ARPU; enterprises offer larger contracts but require longer cycles, compliance, and breadth of features. Atlassian compounded SMB-first into enterprise penetration; Snowflake went enterprise-first from day one.
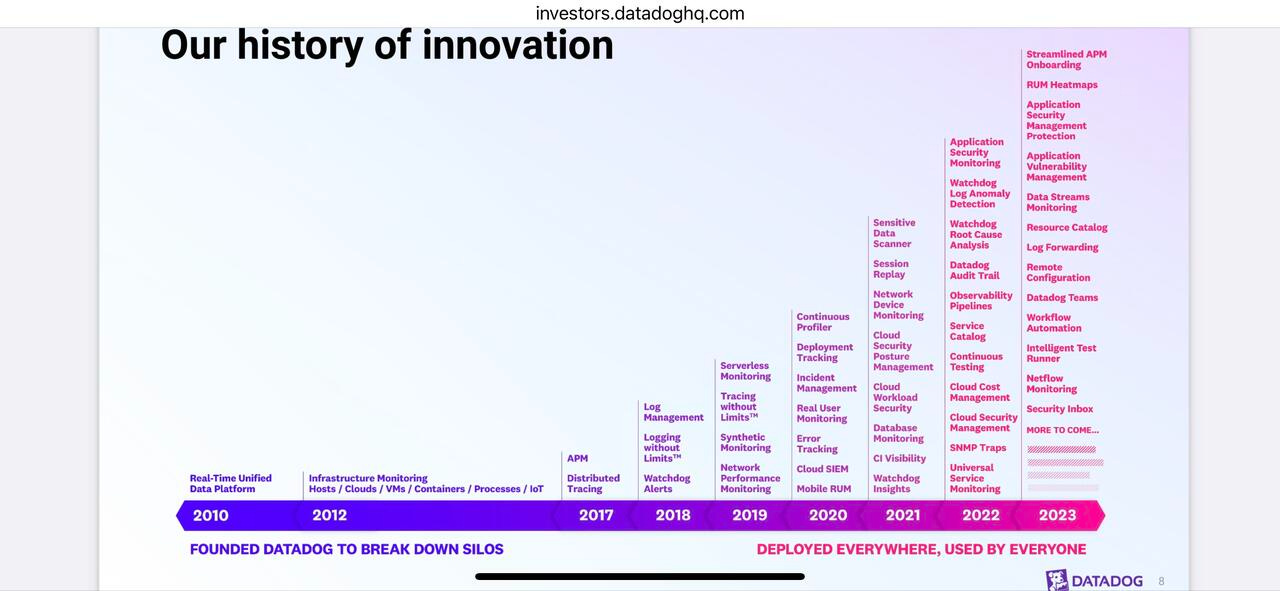
- Product scope. Expanding beyond the initial wedge product multiplies ARPU and defensibility. The sequence matters: modules must reinforce the core, not dilute it. Datadog executed this by layering observability, APM, security, and cost management; Evernote, by contrast, diluted itself with unfocused add-ons.
Treat each zone of the cube as an expansion mix with explicit conditions.
Concrete examples
-
Lovable (2023): an AI-native website builder. Entry market: indie developers and small agencies who need to ship quickly. SAM0 looked small (indie devs building sites), but the expansion mixes open slices of the multi-trillion digital presence market. Expansion path shows how the “cube” plays out:
- Customer segments: starts with SMBs and solo founders; expansion into larger startups once compliance, integrations, and uptime reliability are proven.
- Geography: US-first (English-speaking markets with high PLG adoption), then EU/LatAm once templates and language support are mature.
- Product scope: from website scaffolding → full-stack design system → integration with payment, analytics, and workflow tools.
- Adoption has been exponential because each build showcases the product publicly (distribution piggyback).
-
Snowflake (2012): cloud data warehouse for enterprise workloads. Focused expansion on enterprise quality and ecosystem integration; TAM expanded through data-sharing and cross-cloud strategy.
- Geography: US-first, then global expansion.
- Customer segments: enterprise from day one, avoiding SMB.
- Product scope: data warehousing → data lake → data sharing → ML workloads.
- Adoption: 1,547 customers in 2018 → 7,828 in 2022, including 287 with >$1M ARR.
- Revenue: $96M in 2018 → $1.9B in 2022 (120% CAGR).
-
Datadog (2008): monitoring for cloud-native developers. ARPU more than doubled in 5 years by cross-selling modules.
- Geography: grew first in North America, then Europe and Asia (global footprint by 2017).
- Customer segments: from startups → mid-market → enterprise; today ~40% of revenue comes from customers spending >$100k annually.
- Product scope: real-time unified data platform → monitoring → logging (2015) → APM (2017) → security (2019) → cloud cost management & much more (2022).
- Adoption: >25k customers by 2022.
- Revenue: $101M in 2016 → $1.68B in 2022 (58% CAGR).
-
Shopify (2006): online store builder for SMB merchants. By layering payments, logistics, and lending, Shopify multiplied its TAM far beyond “website builders.”
- Geography: Canada → US → global.
- Customer segments: SMB merchants initially; gradually moved into mid-market and enterprise (“Shopify Plus”).
- Product scope: payments (2013), POS (2017), logistics & fulfillment (2019), lending (Shopify Capital).
- Adoption: 165k merchants in 2014 → 1.75M in 2021.
- GMV: $15B in 2013 → $197B in 2022.
- Revenue: $67M in 2012 → $5.6B in 2022.
-
Atlassian (2002): Jira for software teams. Proved SMB-first can compound into enterprise dominance if product stickiness is high.
- Geography: Australia → global early.
- Customer segments: product-led growth: SMBs and mid-market first; later deep penetration into enterprise (75% of Fortune 500).
- Product scope: Jira → Confluence → Bitbucket → Trello → OpsGenie → security.
- Adoption: 35k customers in 2010 → 260k+ in 2022.
- Revenue: $215M in 2012 → $2.8B in 2022.
Beware of The cube illusion
It is tempting to visualise market expansion as a neat cube (geography × customer × product) where you can simply “fill in the cells.” This helps anticipation and storytelling. But in reality expansion is conditional and path-dependent:
- Certain geographies only make sense with certain customer types (SMB SaaS in US vs. emerging markets).
- Certain product adjacencies only unlock once adoption is entrenched in a segment (Datadog security only worked once embedded with DevOps).
- Business model shifts can expand TAM inside the same cube cell (e.g., usage-based pricing increasing ARPU).
The cube is useful for clarity, but founders must remember it is a simplification. Markets don’t grow linearly along axes, they grow through sequences of interdependent bets.
Key point: Market expansion is not a straight line. Market size grows through execution, not abstraction. The critical question is sequencing across geographies, customer segments, and product scope.
Implication for founders: Sizing is valuable because it forces anticipation and sequencing: which market, what timing. But don’t overengineer the future and spend too much time on it early on. The higher the uncertainty, the simpler the narrative should be.
4.3. Practical Deliverables
Market sizing for innovative tech is not about precision. The exercise is about credible ballparks, grounded in explicit assumptions, segment logic, and an understanding of where your product can realistically be adopted. The job is to make the market countable enough to guide strategy and fundraising, without pretending to measure the unmeasurable.
The earlier the company, and the more innovative the context, the greater the uncertainty. Here, the rule of thumb is: keep it simple, compelling, and credible.
A) Building Your Entry Market Calculation
-
Job to be done (JTBD): defines the true boundary of your market, not a legacy category label.
- AWS: elastic computing (not “servers”).
- Slack: synchronous communication for teams (not “email replacement”).
- Stripe: developer-led integration of payments (not “acquiring”).
-
Substitutes and complements:
- Substitutes: the incumbent tool, internal build, or workaround you replace.
- Complements: platforms or standards you depend on (clouds, suites, app stores, regulators).
-
Sales-qualified ICP (ballpark): define your first ICP so clearly that you can roughly count them.
Example: AI productivity for French law firms (Entry Market, SAM0):
-
JTBD: AI-assisted drafting, search, and knowledge reuse for fee-earners; measurable time savings and quality control.
-
Substitutes/complements: manual drafting, paralegals, legacy doc search; complements are Google Workspace/Microsoft 365 and legal databases.
-
Sales-qualified ICP
- Country: France
- Vertical: private-practice law firms
- Size: 20-100 employees
- Buyer: Managing Partner / COO / IT or KM lead
- Stack filter: firms on Google Workspace (keep Microsoft 365 for SAM1)
- Behaviour filter: ≥50 percent of staff use GenAI weekly
- Ballparks: France has tens of thousands of lawyers and over ten thousand firm entities. Mid-sized firms (20-100 employees) are a minority; a defendable pool is ~400-800. Apply a stack filter (~30% on Google Workspace) → ~300 firms; apply the behaviour filter (~30% of those) → ~100 near-term targets.
-
Market Entry revenue quick-math
- ~50 users/firm × ~€100 AOV/user/month ≈ €60k ARR/firm
100 firms × €60k ≈ **€6m ARR** reachable in theory within 12–18 months- Reality lens: SAM expresses reachability; conversion (win rate, cycle time, willingness-to-pay, time-to-value) reconciles the ballpark with booked revenue.
-
Next expansion mix preview (SAM1) (18-24 months)
- Rising AI adoption + logo effects → behaviour-ready firms can triple (copy-cat pressure)
- Add Microsoft 365 firms of similar size (likely ≥50 percent of the segment)
- Expand to mid-market/larger firms (100–300+ employees) once referenceable
- Ballpark next expansion mix reachability: ~700–900 firms × €60k ≈ 50m ARR (reachability, not bookings)
This is not “the legal market is €XXB.” It is: “Our entry wedge is 120 firms we can realistically serve in 18 months, then we expand to Microsoft 365 and larger firms.”
B) Creating Your Visual Deliverables
The Layered TAM Cube — Axes:
- Segmentation on the left wall (SMB, mid-market, enterprise, public sector)
- Geographies on the floor (home market, region, global)
- Monetisation level on the vertical axis (price per user, or take-rate, or ARPU bundle)
Boxes:
- Entry Market (‘SAM0’) highlighted in a bright colour.
- Expansion Mix 1 (‘SAM1’) zones adjacent by segment and/or geography.
- Expansion Mix 2 (‘SAM2’) zones stacked higher for the first adjacencies.
Alternative: Price × Users progression
C) Validation methods
Quantify bottoms-up, then check top-down:
- Bottoms-up: count named units in your SAM0/SAM1 × expected spend for this job, with realistic stack/behaviour/compliance filters.
- Top-down: identify the budget pools (e.g.: productivity budgets for legal; a take-rate slice of commerce GMV for Shopify-like plays).
- Credibility test: show that your bottoms-up estimate is plausible relative to the bigger pool, but also specific enough to avoid hand-waving.
Example: Shopify bottoms-up wedge might only look like a $1B market in 2006 (SMB websites × $20/month ARPU). Top-down reconciliation showed that if attached payments and logistics succeeded, they could capture a slice of trillions in retail GMV. Both views had to make sense together.
D) Growth Cadences and Benchmarks
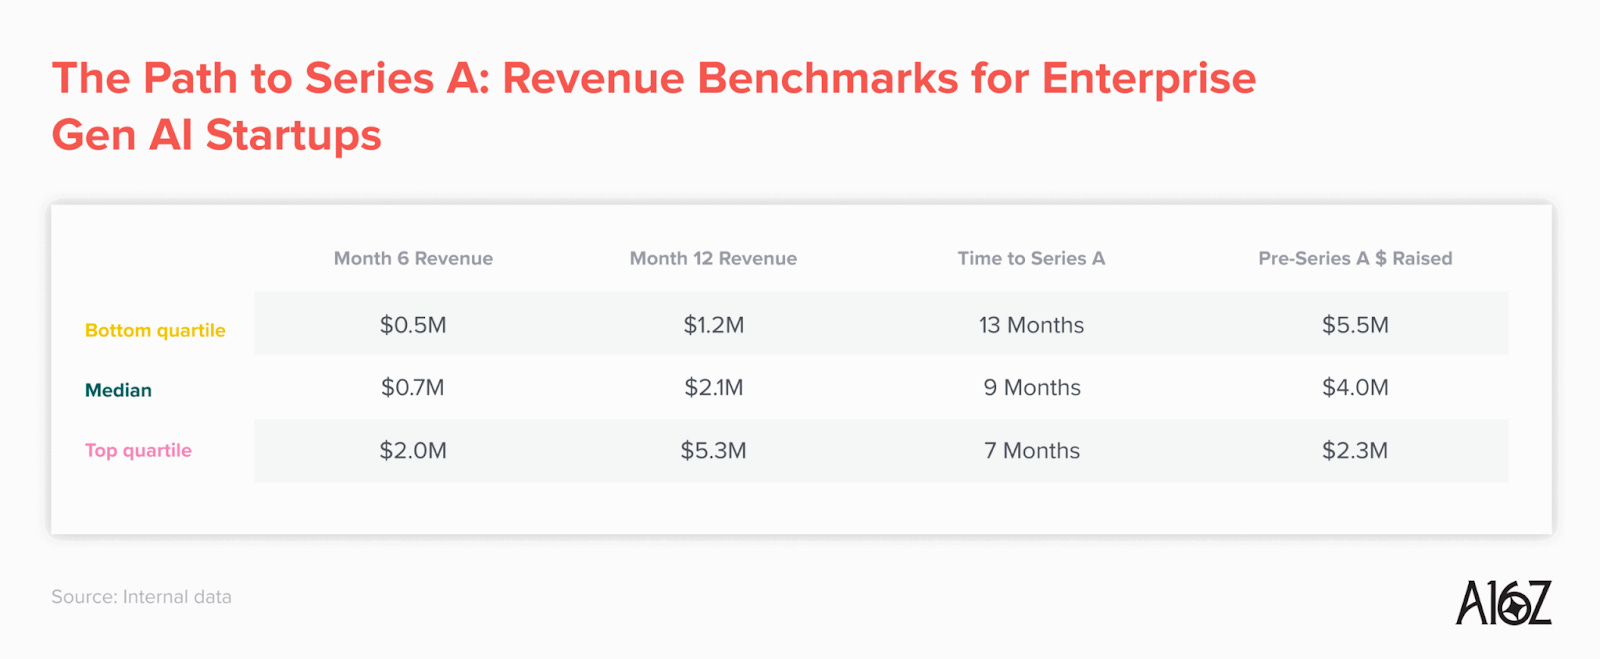
- Classic SaaS “T2D3” (Battery Ventures): from roughly €1m ARR, triple, triple, double, double, double. Useful as an upper-quartile ambition for category-defining SaaS.
- AI-era accelerants (Bessemer, a16z): Bessemer’s State of AI 2025 introduces Q2T3 (quadruple, quadruple, triple, triple, triple) as an outlier bar for top AI.
Recent AI-native companies illustrate why some founders claim this pace is possible:
- ElevenLabs: tens of millions of users within 18 months; billions of characters generated daily.
- Lovable: viral PLG as each new website doubled as distribution.
- Perplexity: rapid MAU growth and paid conversions in 2024-2025 as the product expanded from “answer engine” into an AI browser.
- Suno: converted hobbyist demos into recurring creative spend; ARR grew from near-zero to tens of millions in roughly a year.
These examples don’t set the baseline, most SaaS still grows far below T2D3 (even less Q2T3), but they provide comparables for the quickest velocity in AI.
Adapting cadence to your category:
- Adoption speed: Single-player value propositions (OpenAI’s ChatGPT, Figma’s design tool) can grow at extraordinary speed. Team-level SaaS (Slack, Notion) scales quickly within organisations. Enterprise-first SaaS (Snowflake) grows slower at the start but yields larger ACVs.
- Network/density effects: Datadog-like module attach and integration gravity raise stickiness and ARPU. Uber-like locality density requires a threshold before a market “tips.” Stripe-like developer ecosystems compress time to distribution.
- Concentration potential: If the category tends to consolidate to a few leaders, higher cadences can be sustained. If multi-homing is easy, cadences normalise faster.
E) Scenarios Planning
Scenarios are not models with 1,000 cells. They’re stories you can hold in mind, tied to critical milestones:
- Bull: adoption as fast as we hope, adjacency attaches smoothly, network/density effects kick in, category trends toward concentration.
- Base: adoption steady, first adjacency attaches, market grows but fragmented, defensibility from stickiness.
- Bear: adoption stalls, multi-homing persists, bundlers compress value, category remains fragmented.
Types of Scenarios:
- Bull case (expansive): AWS — what started as developer infrastructure expanded into a trillion-dollar cloud industry. Key driver: technology triggers + compounding adjacencies.
- Base case (steady): HubSpot — started with inbound marketing for SMBs, then steadily layered CRM, sales, and customer service. Key driver: consistent product extension + measured customer expansion.
- Bear case (stalled or diluted): Evernote — initially positioned as the “workspace of the future,” but TAM expansion faltered. Key driver: failure to expand usage intensity + weak defensibility.
The Mechanics Inside Scenarios:
- Adoption rate: how quickly customers move from early adopters to mainstream.
- Usage intensity: frequency and depth of product use.
- Pricing power: ability to increase ARPU through features, upsells, or value capture.
- Network effects: degree to which each new user increases product value.
- Exogenous shocks: regulation, platform shifts, or macroeconomic cycles.
Implication for founders: Do not anchor your story on a single TAM figure. Model scenarios that show how adoption, pricing, usage, and defensibility could evolve.
Final Deliverable Checklist:
- Slide A: Layered TAM Cube with your entry market highlighted, SAM1 blocks adjacent, SAM2 stacked, Platform layer labeled clearly.
- Slide B: Price × Users progression with SKU and module steps on X, user bands by geography on Y, and an ARR potential diagonal.
- Sheet 1: Entry market math: ICP count × users per account × price per user × adoption percent, plus sensitivity.
- Sheet 2: SAM1 preview: show each expansion lever separately to avoid double counting.
- One memo: JTBD, substitutes, complements, stack and filters, and a short scenario section.
Key point: The core market exercise is JTBD + a sales-qualified ICP (for your Entry Market) and a layered map of Expansion Mixes (SAM1, SAM2, etc.) that shows how the opportunity becomes reachable over time.
5. Common Pitfalls and How to Avoid Them
Most market sizing mistakes are not about being wrong, they’re about being misleading, strategically empty, or impossible to execute against.
The traps:
- Hand-wavy TAMs: “AI is a $1T market.” Too broad, untethered from the job you actually solve.
- Category conflation: inflating TAM by stacking categories or overlapping spend pools.
- Ignoring constraints: assuming that all spend is reachable when in fact access depends on regulation, platform control, or procurement rules.
- Linear extrapolation: adoption dynamics don’t follow smooth lines; they are S-curves, often small at the start, accelerating sharply with inflection, then flattening.
- Fantasy adjacencies: showing payments, logistics, or lending as if they were natural extensions. In reality, adjacencies are harder to reach than slides suggest.
- Deterministic TAMs: presenting only a bull case, as if one trajectory were guaranteed.
- Over-engineering under uncertainty: the earlier and more innovative the company, the simpler the sizing should be.
Implication for founders: Use this as a checklist: before finalising a deck or strategy doc, test your sizing against each trap.
Key point: The biggest danger is not under- or over-estimating your TAM. It is presenting a TAM that is strategically meaningless.
6. Conclusion: market sizing as strategic discipline
Market sizing is one of the most misunderstood exercises in entrepreneurship. Done well, it forces clarity:
- What you solve: the job-to-be-done
- For whom: the first ICP you can actually count.
- Where: the geographies and budget pools you can realistically enter.
- When: the sequence of expansion.
Strong founders don’t have the largest TAM slides. They have the most credible entry market, the cleanest maps of expansion, and the most explicit assumptions about adoption, usage, pricing, and defensibility.
Market sizing is both an internal compass and an external narrative tool. Internally, it disciplines resource allocation, hiring pace, and product sequencing. Externally, it aligns talent, partners, and investors around a plausible trajectory.
Also, crucially, sizing connects directly to:
- Competitive analysis: who else is targeting the same spend pools, what substitutes and complements shape access, and whether the category tends toward fragmentation or concentration.
- Financial modelling & valuation: where Damodaran’s tension between narrative and numbers applies, and where adoption curves, ARPU expansion, and network effects translate into revenues, margins, and ultimately enterprise value.
This article has focused on the inside view: the pragmatic, micro discipline of defining entry markets and expansion mixes. The natural complement is the outside view: understanding how innovations diffuse over time through task creation, substitution, adoption frictions, shocks, and curve dynamics. Stay tuned for further articles on innovation diffusion.
Grateful to Martin Mignot for the inspiration, and Mathieu Daix & Stanislas Lot for their sharp observations and feedback.
Originally published on Libido Sciendi — 03 Oct 2025